Industrial maintenance KPI: defining the right indicators in your CMMS
Every business owner knows that KPI maintenance (Key Performance Indicators, or key performance indicators) are essential to the success of an organization. The follow-up of KPI maintenance equipment, as well as its transformation into powerful data using a sophisticated analysis tool integrated into your computer maintenance management solution (GMAO), can help you identify and prioritize the goals of your business, which, like each structure, has its own needs and objectives.
So, how do you choose, compare and monitor the right performance indicators? In addition, how can your CMMS help you assess and integrate these maintenance KPIs into your daily maintenance routines?
How do you choose the right maintenance KPIs?
The establishment of KPI maintenance, or any other performance indicator, is directly linked to a certain objective that is supposed to lead the company to success. It should be remembered that data makes it possible to transform the targeted results into actions; all data must therefore be correctly collected (using sensors, condition monitoring techniques, etc.) in order to obtain transparent and accurate results.
In addition to the performance of the equipment, the maintenance records, information on training and the performances carried out are accessible to all members of the maintenance team in the GMAO. Finally, the analysis of all this data must be done in the most reliable way possible. Mobility Work, community maintenance management platform, provides an elaborate analysis tool directly integrated into the tool for fast and reliable results.
It is essential for a business to choose the right data in order to achieve satisfactory performance. Each team member should understand their importance and be able to realize the impact of their activities on achieving overall business goals. Finally, the implementation of performance measures must be done with a clear initial idea of the desired result.
More maintenance metrics tutorials:
- Matrix: How can I analyze the criticality of my maintenance?
- How do I visualize the load/capacity of my machine park in my CMMS?
- MTTR, MTBF, Failure Rate, Maintainability, and Machine Availability
- Follow Mobility Work on YouTube
The 4 main categories of indicators
1. Key performance indicators (maintenance KPIs)
Some of the main examples of key performance indicators, in particular, we can mention the availability rate of key equipment, measured as a percentage. Les KPI maintenance are directly linked to the main success factors of a business, which means they focus on the aspects of organizational performance that are most critical to the current and future success of the business.
By monitoring them, management is in a position to significantly increase business performance by eliminating the risks associated with unexpected breakdowns.
2. Performance indicators (PI)
Les performance indicators are linked to the performance of the team and are strictly non-financial (unlike performance indicators): planning rate, implementation rate, MTBF (mean time between failures), the first-level maintenance rate, etc.
3. Key result indicators (KRI)
Key result indicators reflect the overall performance of a company. Since they are always reported too late to really change the direction of a process, they are taken more into account in future decision-making. These various indicators include service costs, cycle time, and spare parts inventory.
4. Result indicators (RI)
The performance indicators show whether the company met its performance objectives, for example by measuring differences in the maintenance budget (expenses and stocks), etc.
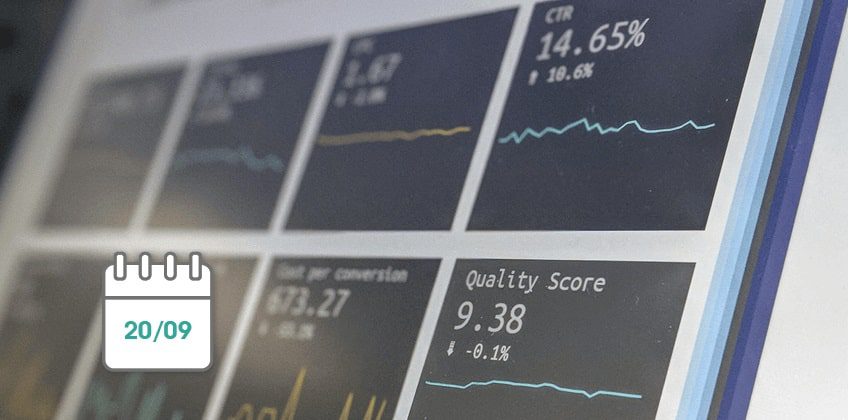
To make these performance measures meaningful data, they need to be stored in a database and analyzed. Here's what a typical performance indicator database looks like in Mobility Work:
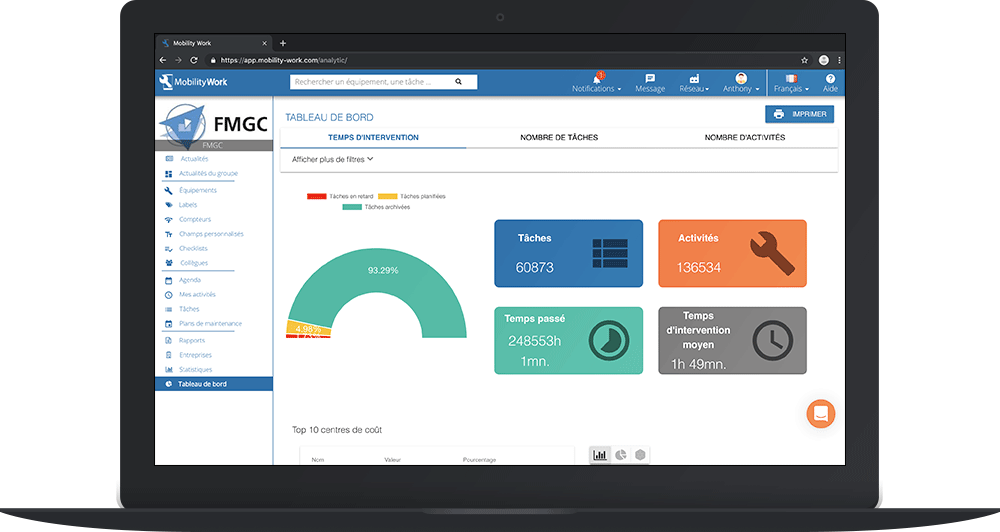
Analyze your maintenance KPIs in your mobile CMMS
Key examples of asset performance measurement
Here is a non-exhaustive list of the characteristics to take into account in your analysis if you want to obtain good maintenance KPIs.
1. Availability of equipment
The availability rate indicates the extent to which an equipment is capable of performing a required function under specific time conditions and in a given state.
The availability rate therefore depends on:
- the number of failures (reliability);
- repair speed (maintainability);
- defined procedures (maintenance organization);
- the quality of the resources (logistics).
There are 3 types of availability rates:
The gross availability rate
The gross availability rate makes it possible to compare the operating time with the availability of the equipment, 24 hours a day and 365 days a year, in order to define, if necessary, whether it is in a situation of overcapacity. This data indicates the rate of use of the company's machines and allows management to avoid unnecessary purchases of certain equipment.
The net availability rate
Net availability is the gross availability minus the “causes of non-functioning” of an asset. These can be defined as follows:
- Production stoppages due to a lack of market demand, whether repeated shutdowns (Saturday/Sunday) or occasional shutdowns over longer periods
- National (not local) strikes, which must be managed internally
- The lack of energy for reasons outside the site
The intrinsic or inherent availability rate
The intrinsic (inherent) availability rate indicates the probability that equipment is operating properly, taking into account only the active operation and repair times of the equipment. This rate is calculated as follows (MTBF: average time between failures, MTTR: average repair time):
Intrinsic availability = MTBF
MTBF + MTTR
2. Equipment reliability
MTBF (mean time between failures)
This indicator shows the probability that equipment will perform a required operation under given conditions and within a well-defined period of time.
MTBF = Total operating time over a given period
Number of failures
Other reliability indicators
There are other reliability indicators, including the MTTF (mean time before failure), which indicates the average operating time of the system before the first failure, and the MUT (average operating time after repair).
3. Relevance of maintenance
Scheduling rate analysis
The formula is as follows:
Scheduling rate = sum of planned hours for planned operations
total number of hours available
The ideal scheduling rate is 100%.
Analysis of the implementation rate of the plan
The plan's completion rate measures all the factors that could disrupt planned operations on a daily basis:
The formula is as follows:
Completion rate = sum of the planned hours of planned and completed operations
Sum of planned hours of planned operations
4. Effectiveness of interventions
MTTR (average repair time)
Maintainability of equipment is essential and includes the act of maintaining or restoring an asset in a condition in which it can perform its assigned function, given that maintenance is carried out under specific conditions, with prescribed means and procedures. This capacity can be measured by the probability that a stopped asset will be in service after a period of time:
M (t) prob (TRT< t), where TRT is the technical repair time.
The MTTR (average repair time) can be measured using the following formula:
MTTR = Total repair time over a given period
Number of failures
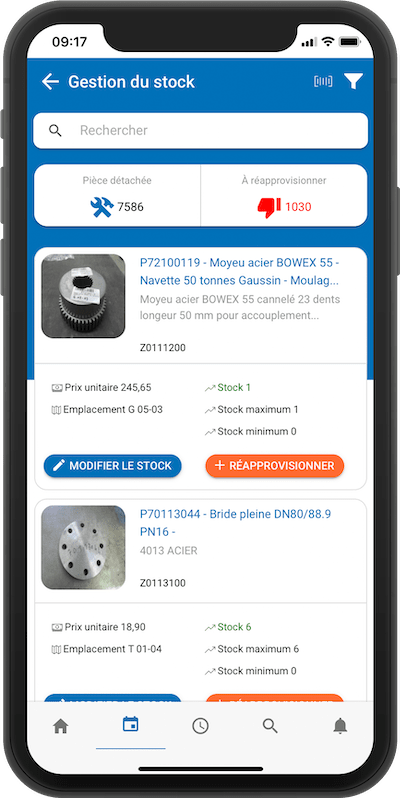
Manage your equipment, tasks and interventions from the CMMS mobile application
Spare parts inventory
The maximum stock of spare parts must be determined machine by machine according to the following parameters: criticality level of the machine, delay of spare parts, etc.
5. Intervention costs
Total cost control includes the following categories:
- In-house staff
- Outsourcing
- Spare parts
The analysis of causes and effects makes it possible to identify the following elements when defining your maintenance KPIs:
- The conditions of use of the equipment (respect of tolerance ranges and capacities);
- User competence in first-level maintenance;
- The quality of the equipment: ease of use, robustness, ease of maintenance;
- The quality of the equipment also depends on the criteria for purchasing the machine;
- Standardization of equipment and spare parts;
- Organization and methods of intervention: quality of the initial diagnosis, classification of emergencies, programming, etc.;
- Quality of communication between users and maintenance specialists.
It is important to note that all data should be collected during a period that is representative of the life cycle of a process and that circumstances such as seasonality or special requests should be taken into account.
Some external elements have a significant influence on your KPI maintenance, including:
- the size of the maintenance team;
- the expertise of the team (analysis of the causes of breakdowns);
- the location of the repair shop;
- the planning of maintenance interventions;
- procedures (first, second, etc. levels);
- the use of labour standards;
- availability of spare parts;
- identifying priorities: very critical equipment (A), moderately critical (B), weakly critical (C).
Mobility Work is a maintenance management platform in SaaS mode, specially designed and developed by and for maintenance professionals. Our team knows and understands the challenges of maintenance and has therefore created a solution adapted to the specific needs of maintenance professionals and adaptable to all industries.
Any questions?
Contact us to discover the first CMMS that can be deployed in 3 weeks.