Pareto and CMMS: towards an evolution of maintenance analysis

Pareto and CMMS: Definition and examples of implementation
Definition and process
The principle or law of Pareto (law of 80-20, or 20-80) is a theory according to which 20% of the causes are responsible for 80% of the effects. Applicable to various fields and sectors, it is in particular among the maintenance methods the best known in the industrial world. Whether in a BTS maintenance, in engineering school or simply within the maintenance methods departments of companies, fault analysis is directly associated with Pareto diagrams, whose aim is to establish a hierarchy of the causes of a phenomenon.
The aim of the Pareto distribution is to Classify maintenance interventions according to their number, and then to prioritize them according to their priority. Here are the few steps required to create a Pareto chart:
- Group interventions by type of failure
- Arrange these groups in ascending order
- Calculate the total number of interventions or the time spent according to the type of Pareto chart you want to analyze
- Calculate the percentage by group: number of interventions/total or time spent/total
- Realization of the graph
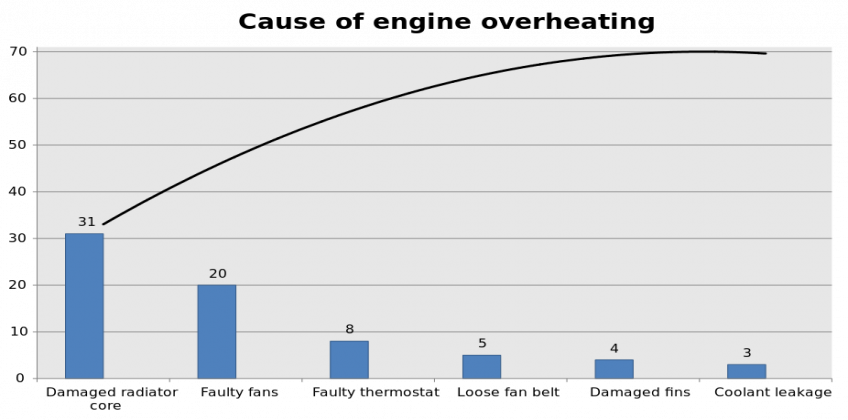
Example: Cause of engine overheating
While all this seems quite simple, there are unfortunately several essential variables that differentiate maintenance courses from the reality in the field: the quality of the data entered in the CMMS software, the extraction of these data and their analysis.
Issues related to current CMMS solutions
La Quality of input by maintenance technicians in asset management software represents a recurring problem for services. Indeed, the lack of ergonomics of maintenance software whose design and interface are often outdated, the multitude of fields to fill in and the difficulty using CMMS make entering information a real obstacle course for the assigned technician.
Poor input quality can also be the result of poor communication with technicians. If no concrete data or benefit can be drawn by the maintenance department following an entry of information by a technician, all this work will be in vain, and the loss of value is significant.
Mobility Work CMMS, an affordable and effective solution
This is the reason why Mobility Work offers a ergonomic interface, as well as a news feed like the well-known social networks. The technician can then quickly visualize the work that was done on a similar failure by one of his colleagues a few weeks ago. The data entry job then makes perfect sense, and makes it possible to directly improve their daily lives. They are in fact in a position to make effective decisions by directly consulting the information entered into the asset management software. If a particularly difficult maintenance task is carried out every Monday morning, the Mobility Work analysis tool allows you to justify this task and carry out a upswing Or a investment likely to directly affect the daily lives of technicians.

All the news relating to current interventions are available from the Mobility Work application news feed
The second difficulty posed by current CMMS software concerns data extraction and analysis. Indeed, it is essential to be able to collect relevant data concerning your maintenance interventions, but you still need to have the necessary tool in order to analyze them dynamically. We are familiar with asset management software that involves having to carry out Extractions in Excel format in order to finally be able to analyze them after 2 hours of work. To avoid all this calculation phase, we have integrated a dynamic tool to analyze your interventions in the Mobility Work maintenance application.
Finally, Mobility Work aims to placing maintenance at the heart of the business : community-based, the first maintenance management platform makes it easy to improve communication, not only between teams (day, night, external service providers, etc.), but also between company departments (production, purchasing, quality, etc.). Margins of error and communication faults are thus easily eliminated, and make it possible to improve decision-making.
Questioning the Pareto analysis
However, one question remains: is this the right way to quickly identify problems with equipment? At Mobility Work, our philosophy is different. As you have understood, we have improved the quality of the tools for entering interventions in the CMMS software: simplified ergonomics, use of mobile technologies, etc. We thus propose a diagram to highlight the most used words (whether in terms of frequency and intervention time): the more this word is used, the more consistently it appears. For example, the words that appear most often on the “bucket granulator” equipment are “screws,” “roller,” and “control.” This allows any maintenance user, and without any extraction or computer knowledge, to access in a few seconds the the most recurrent problems on equipment or a production line.
The use of Industry 4.0 solutions This leads us to question the use of some maintenance indicators. It is obvious that these are extremely useful for analyzing failures, but today there are effective and affordable ways to simplify this analysis and obtain similar, even more detailed and comprehensive results. Mobility Work provides all industry sectors with a community maintenance management platform, as well as an ultra-powerful integrated analytics tool. To find out more about our solution and adopt 4.0, do not hesitate to contact us to schedule a demonstration of the Mobility Work platform.
Are you interested in maintenance management and want to know more in order to increase your productivity and save money?
Any questions?
Contact us to discover the first CMMS that can be deployed in 3 weeks.