Preventive maintenance: how to improve your management?
Preventive maintenance is the basis of any successful maintenance strategy, and therefore one of the most important components in managing your maintenance department. Before deploying sensors, techniques for monitoring the condition of equipment and going further, each company must ensure the implementation of preventive maintenance routines. Good planning allows maintenance professionals to reduce equipment downtime and improve the reliability of the company's machine park.
The adoption of an effective planned maintenance program goes hand in hand with the deployment of a next-generation CMMS solution. The main objective of a computer-aided maintenance management system is to meet field expectations and to provide a user-friendly solution with a mobile version. This aspect is of paramount importance for all operators in the field, as it allows them to exchange information in real time. Mobility Work is a SaaS CMMS, specially designed to facilitate the daily routines of the maintenance team through information flows, geolocation tools, search engines, analysis tools and much more.
Mobility Work helps you determine what data is most important for your business and, by analyzing it, provides you with valuable information about the condition of your assets. The following three indicators will help you better manage your preventive maintenance program using your CMMS software.
1. Planned maintenance compliance levels
La preventive maintenance consists of taking proactive actions to combat unexpected downtime and identify potential faults before they develop into a more serious situation. Therefore, the schedules and the punctuality of interventions are of crucial importance. The compliance level of your preventive maintenance represents the percentage of planned preventive interventions that are carried out within a defined time interval.
The steps to take to measure the level of compliance of your preventive maintenance are as follows:
- Define the schedule and planned maintenance tasks for each piece of equipment
- Carry out scheduled maintenance at the specified period
- Measure the percentage of tasks completed within the defined time
- Communicate to your teams the result of preventive maintenance achieved.
Example of calculating the compliance of your planned maintenance:
First day: 4 preventive tasks planned — 3 have been completed
Second day: 4 preventive tasks planned — 2 have been completed
Third day: 4 preventive tasks planned — 1 has been completed
Fourth day: 4 preventive tasks planned — 3 have been completed
Fifth day: 4 preventive tasks planned — 4 have been completed
The completion rate of your planned maintenance will be: (3 +2 +1 + 3 + 4)/(4 + 4 + 4 + 4 + 4 + 4) = 0.65 or 65% for the week.
The rate of completion of planned maintenance can be automatically calculated in Mobility Work and effectively replace your Excel sheets if you are still using them. These results will help you determine if the established maintenance routine covers the needs of your business or if adjustments are still needed in order to achieve better results in terms of asset reliability.
2. Percentage of planned maintenance
As mentioned above, there are two types of maintenance - planned and unplanned. Planned maintenance refers to operations that have been scheduled after taking into account a certain amount of data. This data may include equipment intervention history, operating time, failure time, spare parts, and others.
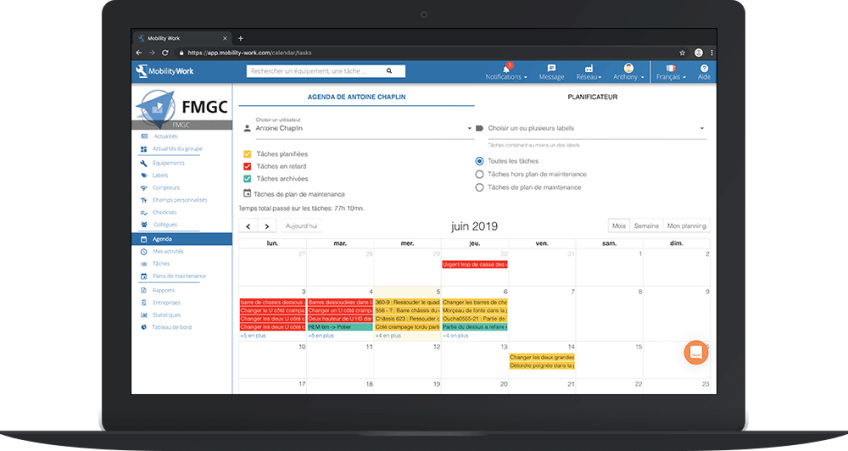
With Mobility Work CMMS software, maintenance teams organize their working day using the calendar.
Unplanned maintenance covers unplanned operations that often occur as a result of a major emergency, critical machine failure, etc. Unplanned maintenance is expensive because it causes unnecessary costs for spare parts, maintenance resources, non-production hours, etc.
The percentage of planned maintenance is the total time of scheduled maintenance in your CMMS software over a range of dates compared to the total number of hours of a service performed by technicians.
If you scheduled 250 hours in the previous month and 400 hours of maintenance were carried out by your maintenance department, then the percentage of scheduled maintenance will be 250/400 or 62.5%. This type of indicator can easily be measured with Mobility Work's analysis tool.
Compared to unplanned maintenance, planned interventions will help you better manage your maintenance service while reducing operating costs. Since maintenance is planned, you can easily optimize the management of your budget, forecast operating costs, and optimize the time of maintenance technicians.
Finally, planned maintenance can improve employee satisfaction, as scheduled interventions are much less stressful than urgent breakdowns.
3. Critical percentage of planned maintenance
However, all maintenance professionals know that scheduled tasks can very often be late. Calculating the critical percentage of planned maintenance (indicating how late planned maintenance tasks are in relation to the maintenance schedule) will help you prioritize the most important operations that need to be completed immediately.
The critical percentage of planned maintenance is calculated as follows:
(Overdue days + maintenance plan period type)/maintenance plan period type * 100% maintenance
A few examples:
- Monthly maintenance plan with 4 days of delays: (4 + 30)/30 * 100 = 113% criticality
- Annual maintenance plan with 10 days of delays: (10 + 365)/365 * 100 = 102% criticality
Calculating the critical percentage of planned maintenance operations helps you prioritize maintenance plans in your CMMS.
Planned maintenance is much less expensive than unplanned interventions. The implementation of the three main indicators presented in this article - levels of planned maintenance compliance, percentage of planned maintenance, and critical percentage of planned maintenance - has a positive impact on the management of your maintenance and quickly improves your performance. All data relating to these three indicators can be successfully collected, stored and analyzed with Mobility Work. In addition, next-generation CMMS streamlines all of your maintenance performances in order to improve the reliability of equipment and the overall production of the plant.
Mobility Work offers youtry for free its maintenance application for a week - don't wait any longer!
Any questions?
Contact us to discover the first CMMS that can be deployed in 3 weeks.